
Source updates Details
Auto check every 5 min with JavaScript. Source checked
Official NHL data
NHL rookie stats 2026-27
2026-27 rookie scoring leaders, with goals, assists and points per game. Filter the regular season table or compare scoring totals with scoring rates.
Rookie scoring leaders
All 89 rookie skaters returned by the NHL for this season.
No matching rookies. Try another filter or reset the search.
| Source PTS rank | Player | Team | Pos | GP | G | A | PTS | P/GP |
|---|---|---|---|---|---|---|---|---|
| 1 | 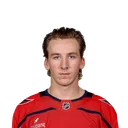 Cole HutsonProfile · D · #44 | WSH | D | 19 | 5 | 10 | 15 | 0.79 |
| 2 |  Trevor ConnellyProfile · L · #24 | VGK | L | 23 | 7 | 7 | 14 | 0.61 |
| 3 |  Gavin McKennaProfile · L · #92 | TOR | L | 23 | 6 | 8 | 14 | 0.61 |
| 4 |  Ivar StenbergProfile · L · #41 | SJS | L | 24 | 7 | 7 | 14 | 0.58 |
| 5 |  Roman KantserovProfile · R · #80 | CHI | R | 21 | 9 | 3 | 12 | 0.57 |
| 6 |  James HagensProfile · C · #44 | BOS | C | 17 | 6 | 6 | 12 | 0.71 |
| 7 |  Judd CaulfieldProfile · R · #28 | ANA | R | 20 | 4 | 7 | 11 | 0.55 |
| 8 | 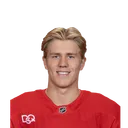 Michael Brandsegg-NygårdProfile · R · #28 | DET | R | 21 | 4 | 7 | 11 | 0.52 |
| 9 |  Victor EklundProfile · R · #38 | NYI | R | 20 | 7 | 4 | 11 | 0.55 |
| 10 |  Anton FrondellProfile · C · #16 | CHI | C | 21 | 4 | 7 | 11 | 0.52 |
| 11 |  T.J. HughesProfile · R · #13 | COL | R | 21 | 2 | 8 | 10 | 0.48 |
| 12 |  Porter MartoneProfile · R · #94 | PHI | R | 24 | 3 | 6 | 9 | 0.38 |
| 13 |  Sandis VilmanisProfile · L · #95 | FLA | L | 20 | 3 | 5 | 8 | 0.40 |
| 14 |  Oliver BonkProfile · D · #59 | PHI | D | 17 | 1 | 6 | 7 | 0.41 |
| 15 | 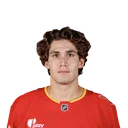 Aydar SunievProfile · L · #61 | CGY | L | 19 | 4 | 3 | 7 | 0.37 |
| 16 | 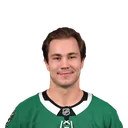 Arttu HyryProfile · R · #25 | DAL | R | 21 | 5 | 2 | 7 | 0.33 |
| 17 |  Ilya ProtasProfile · L · #62 | WSH | L | 19 | 2 | 5 | 7 | 0.37 |
| 18 |  William WallinderProfile · D · #54 | DET | D | 16 | 2 | 4 | 6 | 0.38 |
| 19 |  Noah WarrenProfile · D · #47 | ANA | D | 22 | 0 | 6 | 6 | 0.27 |
| 20 |  Carter MazurProfile · L · #34 | DET | L | 14 | 1 | 4 | 5 | 0.36 |
| 21 |  Frederic BrunetProfile · D · #42 | BOS | D | 14 | 1 | 4 | 5 | 0.36 |
| 22 |  Anton JohanssonProfile · D · #42 | DET | D | 21 | 2 | 3 | 5 | 0.24 |
| 23 |  Cole KnubleProfile · R · #54 | PHI | R | 11 | 4 | 1 | 5 | 0.45 |
| 24 |  Jonathan CastagnaProfile · C · #38 | CGY | C | 19 | 2 | 3 | 5 | 0.26 |
| 25 |  Viggo BjörckProfile · C · #61 | WPG | C | 22 | 1 | 4 | 5 | 0.23 |
| 26 |  Amadeus LombardiProfile · C · #93 | NJD | C | 17 | 0 | 4 | 4 | 0.24 |
| 27 |  Owen MichaelsProfile · R · #43 | EDM | R | 23 | 2 | 2 | 4 | 0.17 |
| 28 |  Florian XhekajProfile · L · #63 | MTL | L | 9 | 1 | 2 | 3 | 0.33 |
| 29 |  Eric PohlkampProfile · D · #48 | SJS | D | 8 | 1 | 2 | 3 | 0.38 |
| 30 |  Carter YakemchukProfile · D · #26 | OTT | D | 15 | 1 | 2 | 3 | 0.20 |
| 31 |  Adam JiricekProfile · D · #36 | STL | D | 17 | 1 | 2 | 3 | 0.18 |
| 32 |  Konsta HeleniusProfile · C · #94 | BUF | C | 11 | 1 | 2 | 3 | 0.27 |
| 33 |  Roger McQueenProfile · C · #95 | ANA | C | 17 | 2 | 1 | 3 | 0.18 |
| 34 |  Tyrel BauerProfile · D · #77 | WPG | D | 16 | 1 | 1 | 2 | 0.13 |
| 35 |  Tyson HindsProfile · D · #55 | ANA | D | 16 | 0 | 2 | 2 | 0.13 |
| 36 |  William StromgrenProfile · L · #65 | CGY | L | 6 | 2 | 0 | 2 | 0.33 |
| 37 | 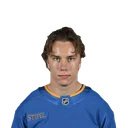 Aleksanteri KaskimakiProfile · C · #41 | STL | C | 10 | 1 | 1 | 2 | 0.20 |
| 38 | 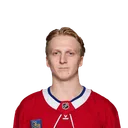 Adam EngstromProfile · D · #42 | MTL | D | 14 | 1 | 1 | 2 | 0.14 |
| 39 | 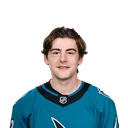 Luca CagnoniProfile · D · #42 | SJS | D | 9 | 1 | 1 | 2 | 0.22 |
| 40 | 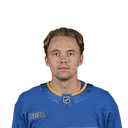 Theo LindsteinProfile · D · #4 | STL | D | 6 | 0 | 2 | 2 | 0.33 |
| 41 |  Bradly NadeauProfile · L · #29 | CAR | L | 3 | 0 | 2 | 2 | 0.67 |
| 42 |  Brayden YagerProfile · C · #29 | WPG | C | 7 | 1 | 1 | 2 | 0.29 |
| 43 |  Sam O'ReillyProfile · R · #23 | TBL | R | 4 | 1 | 1 | 2 | 0.50 |
| 44 |  Vitali PinchukProfile · C · #51 | NSH | C | 12 | 1 | 1 | 2 | 0.17 |
| 45 |  Tyler BoucherProfile · R · #54 | OTT | R | 1 | 1 | 0 | 1 | 1.00 |
| 46 |  Ville OttavainenProfile · D · #46 | SEA | D | 11 | 1 | 0 | 1 | 0.09 |
| 47 |  Brad LambertProfile · C · #93 | WPG | C | 11 | 0 | 1 | 1 | 0.09 |
| 48 |  Rieger LorenzProfile · L · #61 | MIN | L | 6 | 0 | 1 | 1 | 0.17 |
| 49 |  Kenny ConnorsProfile · C · #34 | LAK | C | 3 | 0 | 1 | 1 | 0.33 |
| 50 |  Jared WrightProfile · R · #25 | LAK | R | 4 | 0 | 1 | 1 | 0.25 |
| 51 |  David SpacekProfile · D · #82 | MIN | D | 11 | 0 | 1 | 1 | 0.09 |
| 52 |  Josh SamanskiProfile · C · #81 | EDM | C | 6 | 0 | 1 | 1 | 0.17 |
| 53 | Jacob QuillanProfile · C · #62 | VAN | C | 3 | 0 | 1 | 1 | 0.33 |
| 54 |  Ben McCartneyProfile · L · #62 | UTA | L | 2 | 0 | 0 | 0 | 0.00 |
| 55 |  Jacob GaucherProfile · C · #78 | PHI | C | 4 | 0 | 0 | 0 | 0.00 |
| 56 |  Dylan PetersonProfile · C · #32 | STL | C | 3 | 0 | 0 | 0 | 0.00 |
| 57 |  Martin ChromiakProfile · R · #42 | LAK | R | 2 | 0 | 0 | 0 | 0.00 |
| 58 | Helge Grans | PHI | D | 1 | 0 | 0 | 0 | 0.00 |
| 59 |  Ryan TverbergProfile · C · #77 | TOR | C | 4 | 0 | 0 | 0 | 0.00 |
| 60 |  Xavier BourgaultProfile · R · #53 | OTT | R | 2 | 0 | 0 | 0 | 0.00 |
| 61 | Ryan Ufko | NSH | D | 1 | 0 | 0 | 0 | 0.00 |
| 62 | Zach Dean | STL | C | 3 | 0 | 0 | 0 | 0.00 |
| 63 | William Trudeau | NSH | D | 3 | 0 | 0 | 0 | 0.00 |
| 64 | Alex GagneProfile · D · #28 | COL | D | 1 | 0 | 0 | 0 | 0.00 |
| 65 |  Taylor MakarProfile · L · #16 | COL | L | 2 | 0 | 0 | 0 | 0.00 |
| 66 |  Avery HayesProfile · R · #85 | PIT | R | 1 | 0 | 0 | 0 | 0.00 |
| 67 |  Filip BystedtProfile · C · #18 | SJS | C | 5 | 0 | 0 | 0 | 0.00 |
| 68 |  Jack DevineProfile · R · #38 | FLA | R | 1 | 0 | 0 | 0 | 0.00 |
| 69 |  Jorian DonovanProfile · D · #56 | OTT | D | 1 | 0 | 0 | 0 | 0.00 |
| 70 |  Artem DudaProfile · D · #84 | UTA | D | 6 | 0 | 0 | 0 | 0.00 |
| 71 |  Jagger FirkusProfile · R · #57 | SEA | R | 1 | 0 | 0 | 0 | 0.00 |
| 72 |  Matthew SeminoffProfile · R · #43 | DAL | R | 3 | 0 | 0 | 0 | 0.00 |
| 73 |  Danil ZhilkinProfile · C · #53 | WPG | C | 1 | 0 | 0 | 0 | 0.00 |
| 74 |  Alex BumpProfile · L · #20 | PHI | L | 8 | 0 | 0 | 0 | 0.00 |
| 75 |  Hunter McDonaldProfile · D · #19 | PHI | D | 5 | 0 | 0 | 0 | 0.00 |
| 76 |  Samuel HonzekProfile · L · #29 | CGY | L | 4 | 0 | 0 | 0 | 0.00 |
| 77 |  Nico MyatovicProfile · L · #48 | ANA | L | 4 | 0 | 0 | 0 | 0.00 |
| 78 |  David ReinbacherProfile · D · #64 | MTL | D | 1 | 0 | 0 | 0 | 0.00 |
| 79 |  Cole McWardProfile · D · #82 | TOR | D | 2 | 0 | 0 | 0 | 0.00 |
| 80 |  Felix Unger SörumProfile · R · #36 | CAR | R | 3 | 0 | 0 | 0 | 0.00 |
| 81 |  Hoyt StanleyProfile · D · #73 | OTT | D | 4 | 0 | 0 | 0 | 0.00 |
| 82 | Charles Alexis Legault | CAR | D | 2 | 0 | 0 | 0 | 0.00 |
| 83 | Cole Beaudoin | NYR | C | 4 | 0 | 0 | 0 | 0.00 |
| 84 |  Anton SilaevProfile · D · #52 | NJD | D | 1 | 0 | 0 | 0 | 0.00 |
| 85 |  Trey TaylorProfile · D · #27 | DAL | D | 7 | 0 | 0 | 0 | 0.00 |
| 86 |  Jack WilliamsProfile · C · #92 | CBJ | C | 5 | 0 | 0 | 0 | 0.00 |
| 87 |  Alberts SmitsProfile · D · #12 | NYR | D | 17 | 0 | 0 | 0 | 0.00 |
| 88 |  Nikita KlepovProfile · R · #40 | ANA | R | 4 | 0 | 0 | 0 | 0.00 |
| 89 |  Dylan HryckowianProfile · R · #46 | DAL | R | 2 | 0 | 0 | 0 | 0.00 |
2026-27: points and scoring rates compared
Who ranks higher by scoring rate than by total points?
At a glance. James Hagens has 12 points in 17 games (0.71 points per game): points rank 5, rate rank 2. That is 3 places higher by rate within the same 40 rookies.
Total points show what a rookie has already produced. Points per game put players with different game counts on a common scale. A player can sit lower by total points and higher by scoring rate without his results having changed. Read games played alongside either rank: 10 games is our entry threshold, not a guarantee of a settled rate. This comparison describes the recorded sample; it does not predict the next game or the final standings.
| Rookie and recorded scoring | Points rank | Rate rank | Difference |
|---|---|---|---|
| Cole HutsonWSH · 15 PTS · 19 GP · 0.79 P/GP | 1 | 1 | Same rank |
| James HagensBOS · 12 PTS · 17 GP · 0.71 P/GP | 5 | 2 | 3 places higher by rate |
| Trevor ConnellyVGK · 14 PTS · 23 GP · 0.61 P/GP | 2 | 3 | 1 place lower by rate |
| Gavin McKennaTOR · 14 PTS · 23 GP · 0.61 P/GP | 2 | 3 | 1 place lower by rate |
| Ivar StenbergSJS · 14 PTS · 24 GP · 0.58 P/GP | 2 | 5 | 3 places lower by rate |
| Roman KantserovCHI · 12 PTS · 21 GP · 0.57 P/GP | 5 | 6 | 1 place lower by rate |
| Judd CaulfieldANA · 11 PTS · 20 GP · 0.55 P/GP | 7 | 7 | Same rank |
| Victor EklundNYI · 11 PTS · 20 GP · 0.55 P/GP | 7 | 7 | Same rank |
| Michael Brandsegg-NygårdDET · 11 PTS · 21 GP · 0.52 P/GP | 7 | 9 | 2 places lower by rate |
| Anton FrondellCHI · 11 PTS · 21 GP · 0.52 P/GP | 7 | 9 | 2 places lower by rate |
Explore points per 82 games and team goal shares
At a glance. Points per 82 games shows how many points a rookie would score if he kept his current rate for 82 games. It is a rate, not a prediction. Cole Hutson leads at 65 points per 82 games among the 40 rookies with 10 or more games played. Only 10 to 24 games played so far, so one point still moves these rates a lot.
| Rookie | Points per 82 games | Games played | Points | Goals | Share of team goals |
|---|---|---|---|---|---|
| Cole HutsonWSH | 65 | 19 | 15 | 5 | 7.8% |
| James HagensBOS | 58 | 17 | 12 | 6 | 8.5% |
| Trevor ConnellyVGK | 50 | 23 | 14 | 7 | 9.2% |
| Gavin McKennaTOR | 50 | 23 | 14 | 6 | 8.3% |
| Ivar StenbergSJS | 48 | 24 | 14 | 7 | 11.3% |
| Roman KantserovCHI | 47 | 21 | 12 | 9 | 17.3% |
| Judd CaulfieldANA | 45 | 20 | 11 | 4 | 4.7% |
| Victor EklundNYI | 45 | 20 | 11 | 7 | 10.9% |
| Michael Brandsegg-NygårdDET | 43 | 21 | 11 | 4 | 7.3% |
| Anton FrondellCHI | 43 | 21 | 11 | 4 | 7.7% |
| T.J. HughesCOL | 39 | 21 | 10 | 2 | 2.4% |
| Cole KnublePHI | 37 | 11 | 5 | 4 | 7.0% |
| Oliver BonkPHI | 34 | 17 | 7 | 1 | 1.8% |
| Sandis VilmanisFLA | 33 | 20 | 8 | 3 | 4.2% |
| Porter MartonePHI | 31 | 24 | 9 | 3 | 5.3% |
| William WallinderDET | 31 | 16 | 6 | 2 | 3.6% |
| Aydar SunievCGY | 30 | 19 | 7 | 4 | 7.1% |
| Ilya ProtasWSH | 30 | 19 | 7 | 2 | 3.1% |
| Carter MazurDET | 29 | 14 | 5 | 1 | 1.8% |
| Frederic BrunetBOS | 29 | 14 | 5 | 1 | 1.4% |
| Arttu HyryDAL | 27 | 21 | 7 | 5 | 8.5% |
| Noah WarrenANA | 22 | 22 | 6 | 0 | 0.0% |
| Konsta HeleniusBUF | 22 | 11 | 3 | 1 | 1.7% |
| Jonathan CastagnaCGY | 22 | 19 | 5 | 2 | 3.6% |
| Anton JohanssonDET | 20 | 21 | 5 | 2 | 3.6% |
Read with care. The season has 84 games; 82 is only the yardstick. Formulas are under How we calculate.
- Few games. The ranked rookies have played only 10 to 24 games, so one more point moves a rate by 3 to 8 points per 82 games.
- Small samples. Rookies with fewer than 10 games (49 now) are listed separately and never ranked above the others.
- Rank comparison = points rank minus scoring rate rank, using the same listed rookies with valid points totals and at least 10 games. Equal points totals or exact equal points per game share competition ranks (1, 1, 3). A positive difference means higher by rate, not improvement over time. Main table source row numbers are a separate ordering.
- Share of team goals = the rookie's goals divided by his team's goals so far. We work out team goals from the NHL's goals-per-game average, so they are derived, not counted.
- Scope. All rookie skaters returned by the NHL feed this table.
Small sample: 49 rookies with fewer than 10 games
| Rookie | Points per 82 games | Games played | Points | Goals | Share of team goals | Sample |
|---|---|---|---|---|---|---|
| Tyler BoucherOTT | 82 | 1 | 1 | 1 | 1.5% | Small sample |
| Bradly NadeauCAR | 55 | 3 | 2 | 0 | 0.0% | Small sample |
| Sam O'ReillyTBL | 41 | 4 | 2 | 1 | 1.3% | Small sample |
| Eric PohlkampSJS | 31 | 8 | 3 | 1 | 1.6% | Small sample |
| Florian XhekajMTL | 27 | 9 | 3 | 1 | 1.5% | Small sample |
| William StromgrenCGY | 27 | 6 | 2 | 2 | 3.6% | Small sample |
| Theo LindsteinSTL | 27 | 6 | 2 | 0 | 0.0% | Small sample |
| Kenny ConnorsLAK | 27 | 3 | 1 | 0 | 0.0% | Small sample |
| Jacob QuillanVAN | 27 | 3 | 1 | 0 | 0.0% | Small sample |
| Brayden YagerWPG | 23 | 7 | 2 | 1 | 1.5% | Small sample |
| Jared WrightLAK | 21 | 4 | 1 | 0 | 0.0% | Small sample |
| Luca CagnoniSJS | 18 | 9 | 2 | 1 | 1.6% | Small sample |
| Rieger LorenzMIN | 14 | 6 | 1 | 0 | 0.0% | Small sample |
| Josh SamanskiEDM | 14 | 6 | 1 | 0 | 0.0% | Small sample |
| Ben McCartneyUTA | 0 | 2 | 0 | 0 | 0.0% | Small sample |
| Jacob GaucherPHI | 0 | 4 | 0 | 0 | 0.0% | Small sample |
| Dylan PetersonSTL | 0 | 3 | 0 | 0 | 0.0% | Small sample |
| Martin ChromiakLAK | 0 | 2 | 0 | 0 | 0.0% | Small sample |
| Helge GransPHI | 0 | 1 | 0 | 0 | 0.0% | Small sample |
| Ryan TverbergTOR | 0 | 4 | 0 | 0 | 0.0% | Small sample |
| Xavier BourgaultOTT | 0 | 2 | 0 | 0 | 0.0% | Small sample |
| Ryan UfkoNSH | 0 | 1 | 0 | 0 | 0.0% | Small sample |
| Zach DeanSTL | 0 | 3 | 0 | 0 | 0.0% | Small sample |
| William TrudeauNSH | 0 | 3 | 0 | 0 | 0.0% | Small sample |
| Alex GagneCOL | 0 | 1 | 0 | 0 | 0.0% | Small sample |
Compare two rookies
| Season stats | Cole HutsonProfile · D · #44 | Trevor ConnellyProfile · L · #24 |
|---|---|---|
| GP | 19 | 23 |
| G | 5 | 7 |
| A | 10 | 7 |
| PTS | 15 | 14 |
| P/GP | 0.79 | 0.61 |
| Shots | 41 | 49 |
| PP PTS | 5 | 3 |
| TOI/GP | 19:36 | 14:27 |
Compare with last season
At a glance. This compares 2026-27 rookies with last season's final totals. Cole Hutson leads with 15 points so far, against 62 for Ivan Demidov in 2025-26. At their current rate, 1 of the 40 rookies reach the points leader total (62), 8 the 5th place total (45) and 21 the 25th place total (24).
| Measure | 2026-27 so far | 2025-26 final totals |
|---|---|---|
| Points leader | Cole Hutson · 15 points | Ivan Demidov · 62 points |
| Games played by the leader | 19 | 82 |
| Points per game of the leader | 0.79 | 0.76 |
| Average points per game, top 5 by points | 0.63 | 0.71 |
| Points needed to make the top 25 | 5 | 24 |
| Top-25 rookies at 0.50 or more points per game | 10 of 25 | 6 of 25 |
2026-27 rookies against last season's final totals
| 2025-26 place | Final points | Rookies at or above that rate | Who |
|---|---|---|---|
| Points leader | 62 | 1 | Cole Hutson |
| 5th place | 45 | 8 | Cole Hutson, James Hagens, Trevor Connelly and 5 more |
| 25th place | 24 | 21 | Cole Hutson, James Hagens, Trevor Connelly and 18 more |
How we calculate
Show formulas and rules
- Points per game = points / games played. Unavailable at 0 games.
- Points per 82 games = points per game x 82. Goals per 82 games and assists per 82 games use goals or assists in place of points and are in the CSV download. Shown as whole numbers. It is a rate, not a forecast. The current season has 84 games; 82 is only the fixed yardstick that makes these rates comparable with the 82-game final totals of 2025-26.
- Small sample = fewer than 10 games played. Small samples are marked and never ranked above rookies with 10 or more games.
- Share of team goals = player goals / team goals. Team goals = NHL goals for per game x team games played, rounded to a whole number. Points are not divided by team goals because assists count toward points but not toward goals.
- 0.50 or more points per game counts rookies with 10 or more games and points / games played of 0.50 or higher.
- 2025-26 comparison sets points per 82 games against final totals from the saved 2025-26 list. The saved list holds the Top 25 by points only.
Download and cite the data
LNODEK. NHL rookie stats 2026-27. Source: NHL statistics (api.nhle.com), checked Nov 19, 2026, 1:46 a.m. UTC. https://lnodek.com/nhl/stats/rookies/
LNODEK. NHL rookie scoring rank comparison, points per 82 games and share of team goals, 2026-27. Calculated by LNODEK from NHL statistics (api.nhle.com), checked Nov 19, 2026, 1:46 a.m. UTC. https://lnodek.com/nhl/stats/rookies/
NHL rookie stats guide
Which players are included?
The NHL's regular season skater dataset identifies rookie players. LNODEK uses that source classification. The table states whether the full returned rookie list is verified or only the saved Top 25 points snapshot is available. Goalies are outside this skater table.
How are rookie scoring leaders ranked?
The table starts with 25 matching rookies. Use Show all to expand the list; searches, team filters and sorting still use every listed player. The source list is ordered by points, with player ID breaking ties. Points are goals plus assists. The compact category leaders use every skater in the displayed list and identify tied leaders. Source PTS rank is the original row order; it stays fixed when you sort by goals, assists or points per game.
What does P/GP mean?
Points per game is total points divided by games played, displayed to two decimal places. A short sample can produce a high rate, so use the minimum games filter when comparing players. A missing value or zero games is shown as unavailable for this rate.
Where can I find shots, power play points and ice time?
The player comparison includes shots on goal, power play points and average ice time per game when the NHL source provides them. Ice time uses minutes and seconds. Unavailable source values remain labelled rather than becoming zero.
Does the points leader lead the Calder Trophy race?
Scoring totals describe recorded games. They are not an award ranking or a prediction of the Calder Trophy vote. Position, role and other parts of a rookie's season need separate analysis.
How does this season compare with last season?
The comparison table sets the current Top 25 by points against the saved 2025-26 list of final totals. Early in a season totals are small, so read rates next to games played and the points needed for 25th place. It is a comparison of recorded results, not a forecast.
What are points per 82 games and share of team goals?
Points per 82 games is a rookie's points per game multiplied by 82, so players with different game counts sit on one scale. The CSV download adds goals per 82 games and assists per 82 games. It is a rate, not a forecast, and rookies with fewer than 10 games are marked as a small sample. Share of team goals divides a rookie's goals by team goals (derived from goals for per game and games played). The points versus scoring rate comparison ranks the same rookies with at least 10 games under both measures, with equal values sharing a rank. Every formula is listed under How we calculate.
Can I download or cite this table?
Yes. The CSV button under the comparison downloads every listed rookie as shown, regardless of the filters you set. Its points and rate ranks keep the same valid 10 game minimum cohort; rookies outside that cohort have empty rank fields. The citation line states the source and the time of the last check.
How current are the numbers?
The source check appears beside the season. The page checks for refreshed NHL data while it is visible. The embedded chart checks every five minutes while visible and resumes when you return to it. It does not need a new site build. If a check fails, the last verified records and their actual source date remain available.
Source: official NHL statistics. Rookie classification and season totals come from the NHL; the filters, rate calculation, per-82 rates, share of team goals and comparison are calculated by LNODEK.
Use the NHL scoring leaders for overall production and team special teams. Check NHL line combinations and power play units for separate, dated role context. The team link in each row opens that club's line combinations.
Looking for last season? Open the 2025-26 NHL rookie stats archive, a saved Top 25 snapshot with its original source date.